Using the Diagnostic Tool
You can use the Diagnostic Tool (model > Faults > Tools) during different stages of the modeling process to run multiple quality tests on the fault model tri-meshes. The Diagnostic Tool can detect different types of issues that might trigger unexpected results during subsequent modeling or processing steps. The tool lists all issues in a table and opens a dedicated Diagnostic View where selected issues are highlighted. You can use the table to set the focus in the View on one particular issue and then go through the issues one by one. The table also provides the surface type and TVDSS information about the issue which can be used to search and filter relevant issues.
The best way to prevent and solve such issues is to use the forms in the Tools button group, or manually using the editing tools. You can also review the quality of the triangles by displaying any of the Mesh Quality properties, available in the context menu of a tri-mesh (Properties > Default Geometry Properties > Mesh Quality). However, during the subsequent modeling workflows, you still might run into unexpected issues. Using the Diagnostic Tool to run selected tests on your fault model allows you to spot issues that you want to resolve before continuing with building your reservoir model.
How to use the diagnostic tool
- On the Diagnostic Tool form, in the Model drop-down list, select the model that contains the tri-meshes that you want to check for issues.
- Under Tests, select the issue(s) you want to test the model for. For more information about the different tests, see below.
- Click Run Tests. After running the test(s), the results can be analyzed in the Test Results table and a dedicated Diagnostics view.
- The issues that were found are listed (per category) in the Test Results table at the right side of the form. The table has three columns - first column shows the Issue name, second column shows the respective surface Type and the third column shows the respective depth in TVDSS for the listed issue. Use the column headers to sort the test results, or use the context menu to search and filter the results. The results are grouped in test type, and by default each test type is sorted on surface type followed by the issue name.
- A dedicated Diagnostic View is opened, displaying all the tri-meshes with issues.
- In the table, select the tri-mesh or issue that you want to highlight in the Diagnostic View. Only selected tri-mesh(es) are visualized.
- Use either the tri-mesh tools (prepare > Post-Processing Tools > Tri-mesh Tools, only for tri-meshes in surface sets), the structure builder tools (under the Structure Builder button of the strip that you are working in) or the editing tools (Workspace > Tools) to solve the issues. Rerun the test(s) and check if the issues are corrected to your satisfaction.
- Click Close to close the form. This will also close the Diagnostic View.
If the edited fault model was used in subsequent modeling steps, you have to rerun these modeling steps as well. Before you can assign the fault model to a structural model again, run the Model Validation step.
Selecting a test
Faulted unconformities The diagnostic tool picks up the results from the Model Validation in the Fault Modeling workflow. The issues found will show up in the results listed on the form. It visualizes locations where gaps or offsets are detected in unconformities that are part of your fault model in the dedicated Diagnostic View. Revisit the Solve fault Intersections step or use the editing tools to resolve the reported issue. For more detailed information, see Faulted unconformities.
Folded edges The tri-meshes of your model should not have sharp bends or kinks. Bends are measured via the angle between two adjacent triangles. All triangles with an angle below a maximum specified by you are considered folded and will show up in the results list. The two triangles creating this angle are highlighted in red in the dedicated Diagnostic View.
For more information, see Folded edges.
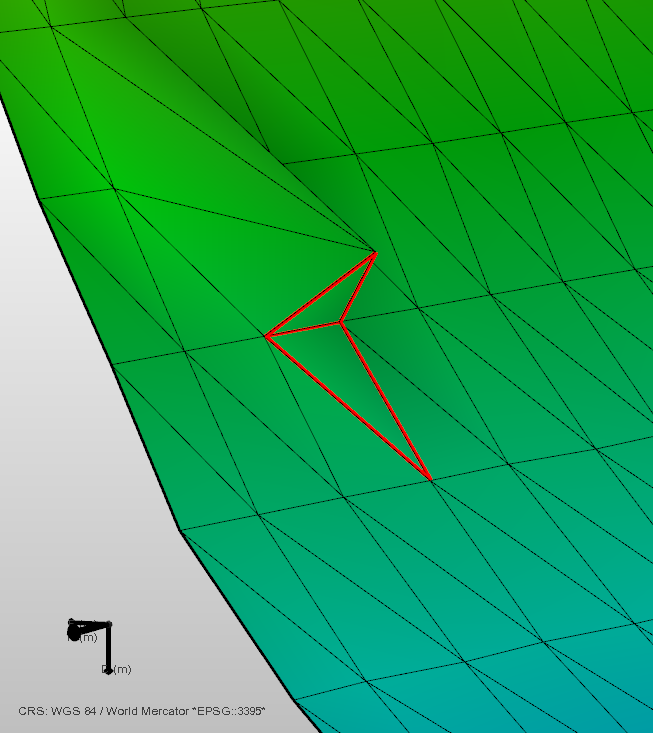
Example of a folded edge. A local angle around 85° is detected in this example. The two triangles that are creating a folded edge are highlighted in red in the Diagnostic View. click to enlarge
Flat triangles Very spiky, elongated triangles may cause unstable results in different processing steps. Flat triangles are measured via the angle between two triangle edges. All triangles with an angle below a maximum specified by you are considered flat triangles and will show up in the results list. The triangle is highlighted in red in the dedicated Diagnostic View.
For more information, see Flat triangles.
Intersection quality This test reports on the geometrical quality of all found intersections in your fault model. The test relies on existing intersections, you need to calculate and resolve the intersections in the Fault Modeling workflow before running the test. It picks up all intersections and determines whether watertight connections are present as opposed to free boundaries where no direct contacts between the fault surfaces have been identified. Remaining gaps on your fault/fault intersections, as well as locations where faults are sticking through each other, may hinder further modeling steps. These issues can introduce geometrical artifacts in the 3D structural model or the derived 3D grid. The issues found can be viewed in the dedicated Diagnostic View. Free boundary sections are highlighted in orange. Watertight sections are highlighted in yellow. For more detailed information, see Intersection quality.
- Free boundary sections are highlighted in orange.
- Watertight sections are highlighted in yellow
Internal boundaries An internal boundary is formed when a tri-mesh contains a gap, which is the case when the edges of one or more triangles are not connected to other triangles. This test identifies and locates these edges. Ideally, every fault surface should be continuous and free of any gaps. Gaps in your faults may not segment your model in a consistent way and local flexures and artifacts can be a result in the 3D Structural Modeling workflow. All the internal boundaries of the tri-mesh are highlighted in red in the Diagnostic View. For more information, see Internal boundaries.
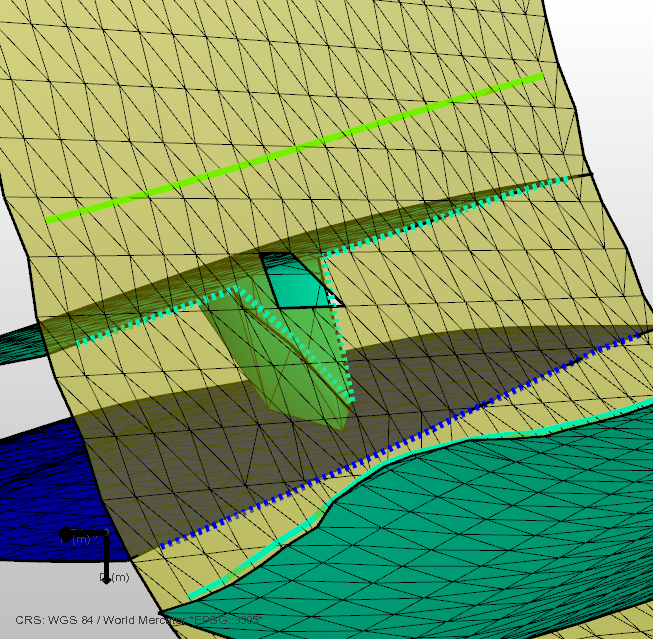
This gap in the fault plane will lead to artifacts in the 3D structural model, as a clear separation of footwall and hanging wall data may not be achieved. click to enlarge